Service graphs
Graph Information
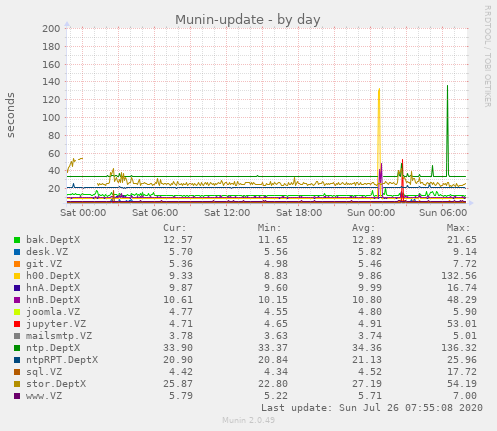
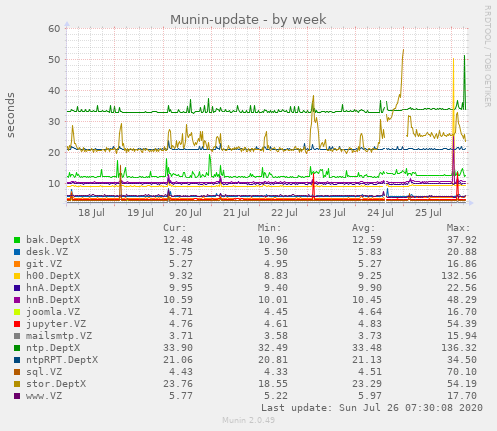
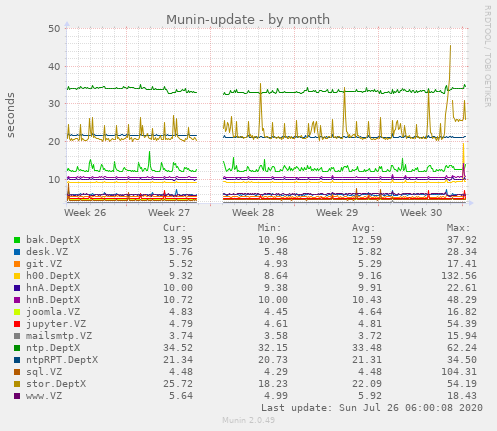
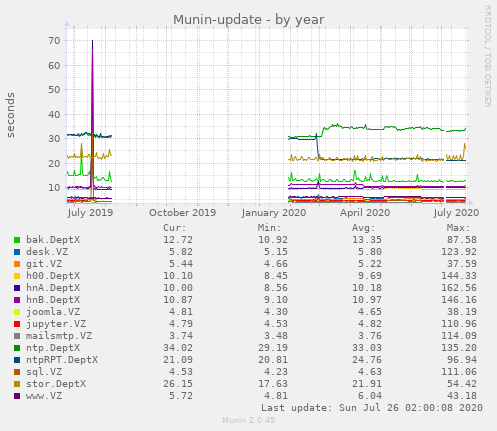
This graph shows the time it takes to collect data from each hosts that munin collects data on. Munin-master is run from cron every 5 minutes and we want each of the munin-update runs to complete before the next one starts. If munin-update uses too long time to run on one host run it with --debug to determine which plugin(s) are slow and solve the problem with them if possible.
| Field |
Internal name |
Type |
Warn |
Crit |
Info |
| bak.DeptX |
bak_DeptX |
gauge |
240 |
285 |
|
| desk.VZ |
desk_VZ |
gauge |
240 |
285 |
|
| git.VZ |
git_VZ |
gauge |
240 |
285 |
|
| h00.DeptX |
h00_DeptX |
gauge |
240 |
285 |
|
| hnA.DeptX |
hnA_DeptX |
gauge |
240 |
285 |
|
| hnB.DeptX |
hnB_DeptX |
gauge |
240 |
285 |
|
| joomla.VZ |
joomla_VZ |
gauge |
240 |
285 |
|
| jupyter.VZ |
jupyter_VZ |
gauge |
240 |
285 |
|
| mailsmtp.VZ |
mailsmtp_VZ |
gauge |
240 |
285 |
|
| ntp.DeptX |
ntp_DeptX |
gauge |
240 |
285 |
|
| ntpRPT.DeptX |
ntpRPT_DeptX |
gauge |
240 |
285 |
|
| sql.VZ |
sql_VZ |
gauge |
240 |
285 |
|
| stor.DeptX |
stor_DeptX |
gauge |
240 |
285 |
|
| www.VZ |
www_VZ |
gauge |
240 |
285 |
|